
What is Excel Power Pivot?
November 13, 2017
Power BI + Python – Data Science
October 29, 2018
Power Query is an additional tool (add-on available in the 2010 version) of Excel which allows to connect, integrate and transform data, technically it is considered an ETL (Extract, Transform and Load) tool, but, for the end user (self-service Business Intelligence), what does it mean?
Connect/Extract
Connect to many other external database sources, including Facebook.

Integration
In other words, this tool enables us to consolidate information from multiple Excel files without the need for additional tools or VBA. For instance, let’s say we have sales data for City A, City B, and City C stored in separate Excel files, and we need to generate a report that aggregates sales for the entire region. With Power Query, this task can be completed easily, allowing us to automate the reporting process. While merging three Excel files may not seem significant, consider companies that track daily sales from various sources; manually compiling this data can be daunting. We have clients who previously took weeks to generate their reports, but with Power Query, they can now accomplish this in just a few hours.

Transformation
Suppose we have information where years are separated from months, and days, it is possible to create calculated columns from other columns.
Some options:
- Split columns of a date separating it into day, month and year
- Replace values
- Create a calculated column
- Filter data
- Sorting
- Change data types
- Conditionals
For example, suppose you have the information from separate financial statements in Excel, by year, and you want to make a historical report of the evolution of the accounts, Income, Operating Expenses, Project Costs, Income Statement, etc., this is not difficult if there are 2 files, but what happens when you have several Excel files.

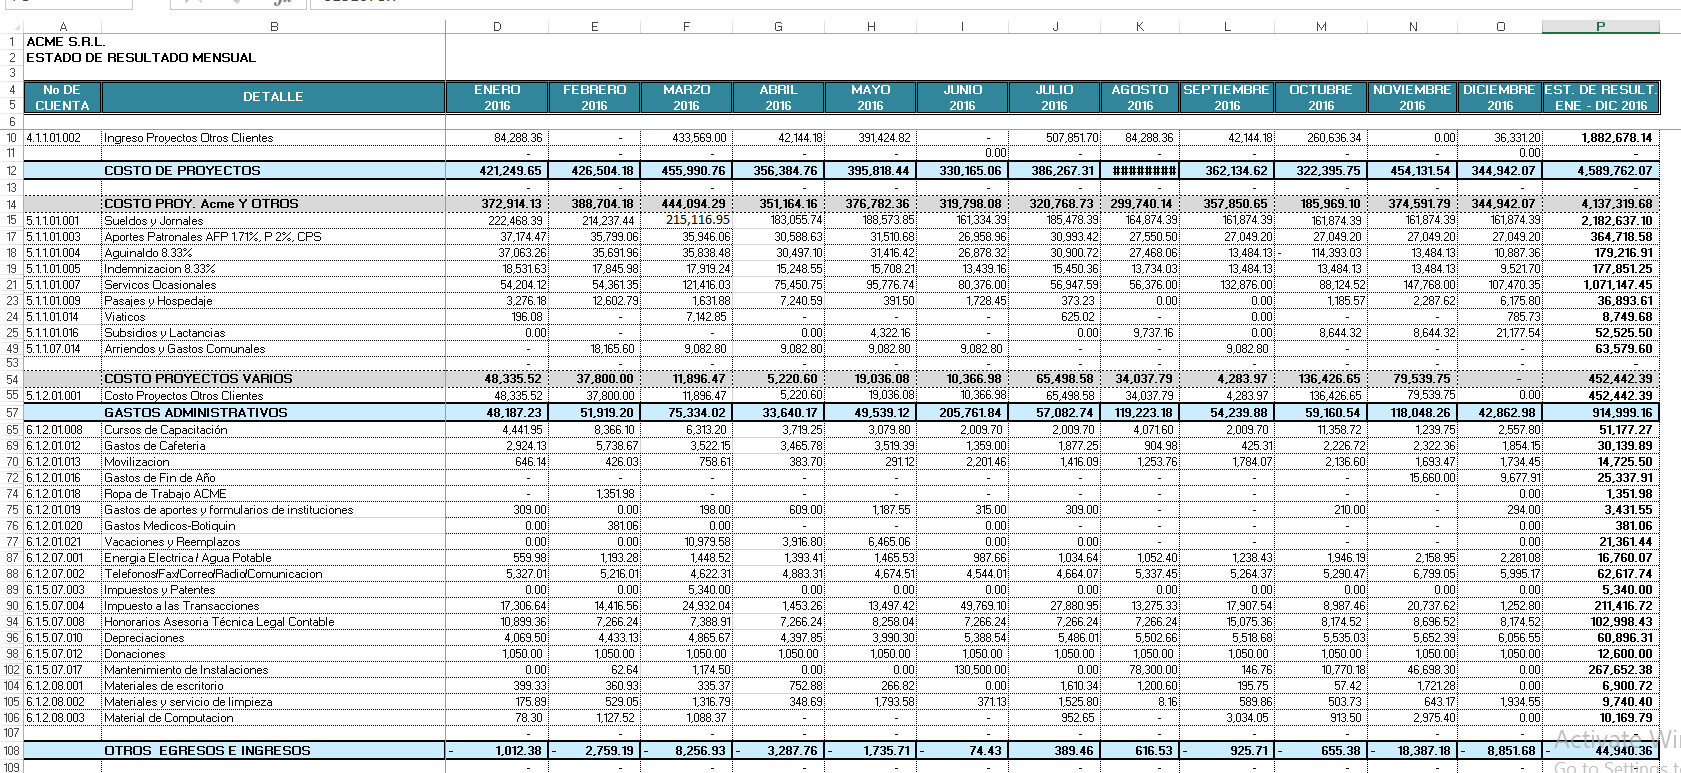
Here is the Power Query result:
let
    Source = Folder.Files("E:\Contabilidad"),
    #"Removed Columns" = Table.RemoveColumns(Source,{"Extension", "Date accessed", "Date modified", "Date created", "Attributes", "Folder Path"}),
    #"Added Custom" = Table.AddColumn(#"Removed Columns", "ObjetosExcel", each Excel.Workbook([Content],true)),
    #"Expanded ObjetosExcel" = Table.ExpandTableColumn(#"Added Custom", "ObjetosExcel", {"Name", "Data", "Item", "Kind", "Hidden"}, {"ObjetosExcel.Name", "ObjetosExcel.Data", "ObjetosExcel.Item", "ObjetosExcel.Kind", "ObjetosExcel.Hidden"}),
    #"Filtered Rows" = Table.SelectRows(#"Expanded ObjetosExcel", each ([ObjetosExcel.Name] = "3")),
    #"Removed Columns1" = Table.RemoveColumns(#"Filtered Rows",{"ObjetosExcel.Item", "ObjetosExcel.Kind", "ObjetosExcel.Hidden", "ObjetosExcel.Name", "Content"}),
    #"Expanded ObjetosExcel.Data" = Table.ExpandTableColumn(#"Removed Columns1", "ObjetosExcel.Data", {"ACME S.R.L.", "Column2", "Column3", "Column4", "Column5", "Column6", "Column7", "Column8", "Column9", "Column10", "Column11", "Column12", "Column13", "Column14", "Column15", "Column16", "Column17", "Column18", "Column19", "Column20", "Column21", "Column22", "Column23", "Column24", "Column25", "Column26", "Column27", "Column28", "Column29", "Column30", "Column31", "Column32", "Column33", "Column34", "Column35", "Column36"}, {"ObjetosExcel.Data.ACME S.R.L.", "ObjetosExcel.Data.Column2", "ObjetosExcel.Data.Column3", "ObjetosExcel.Data.Column4", "ObjetosExcel.Data.Column5", "ObjetosExcel.Data.Column6", "ObjetosExcel.Data.Column7", "ObjetosExcel.Data.Column8", "ObjetosExcel.Data.Column9", "ObjetosExcel.Data.Column10", "ObjetosExcel.Data.Column11", "ObjetosExcel.Data.Column12", "ObjetosExcel.Data.Column13", "ObjetosExcel.Data.Column14", "ObjetosExcel.Data.Column15", "ObjetosExcel.Data.Column16", "ObjetosExcel.Data.Column17", "ObjetosExcel.Data.Column18", "ObjetosExcel.Data.Column19", "ObjetosExcel.Data.Column20", "ObjetosExcel.Data.Column21", "ObjetosExcel.Data.Column22", "ObjetosExcel.Data.Column23", "ObjetosExcel.Data.Column24", "ObjetosExcel.Data.Column25", "ObjetosExcel.Data.Column26", "ObjetosExcel.Data.Column27", "ObjetosExcel.Data.Column28", "ObjetosExcel.Data.Column29", "ObjetosExcel.Data.Column30", "ObjetosExcel.Data.Column31", "ObjetosExcel.Data.Column32", "ObjetosExcel.Data.Column33", "ObjetosExcel.Data.Column34", "ObjetosExcel.Data.Column35", "ObjetosExcel.Data.Column36"}),
    #"Filtered Rows1" = Table.SelectRows(#"Expanded ObjetosExcel.Data", each ([#"ObjetosExcel.Data.ACME S.R.L."] <> "ESTADO DE RESULTADO MENSUAL") and ([ObjetosExcel.Data.Column2] <> null)),
    #"Promoted Headers" = Table.PromoteHeaders(#"Filtered Rows1", [PromoteAllScalars=true]),
    #"Removed Columns2" = Table.RemoveColumns(#"Promoted Headers",{"Column18", "Column19", "Column20", "Column21", "Column22", "Column23", "Column24", "Column25", "Column26", "Column27", "Column28", "Column29", "Column30", "Column31", "Column32", "Column33", "Column34", "Column35", "Column36", "Column37"}),
    #"Added Custom1" = Table.AddColumn(#"Removed Columns2", "GrupoCuenta", each if [DETALLE] ="INGRESOS OPERATIVOS" then [DETALLE] else if[DETALLE] ="COSTO DE PROYECTOS" then [DETALLE] else if [DETALLE] ="GASTOS ADMINISTRATIVOS" then [DETALLE] else if [DETALLE] ="OTROS  EGRESOS E INGRESOS" then [DETALLE] else if[DETALLE] ="RESULTADO DE LA GESTION" then [DETALLE]  else null),
    #"Filled Down" = Table.FillDown(#"Added Custom1",{"GrupoCuenta"}),
    #"Reordered Columns" = Table.ReorderColumns(#"Filled Down",{"Informe Económico_ACME_Diciembre_2016.xlsx", "No DE", "GrupoCuenta", "DETALLE", "GESTIÓN", "ENERO", "FEBRERO", "MARZO", "ABRIL", "MAYO", "JUNIO", "JULIO", "AGOSTO", "SEPTIEMBRE", "OCTUBRE", "NOVIEMBRE", "DICIEMBRE", "EST. DE RESULT."}),
    #"Filtered Rows2" = Table.SelectRows(#"Reordered Columns", each ([No DE] <> null)),
    #"Removed Columns3" = Table.RemoveColumns(#"Filtered Rows2",{"GESTIÓN"}),
    #"Filtered Rows4" = Table.SelectRows(#"Removed Columns3", each ([ENERO] <> "ENERO")),
    #"Unpivoted Columns" = Table.UnpivotOtherColumns(#"Filtered Rows4", {"Informe Económico_ACME_Diciembre_2016.xlsx", "No DE", "GrupoCuenta", "DETALLE"}, "Attribute", "Value"),
    #"Replaced Value" = Table.ReplaceValue(#"Unpivoted Columns","Informe Económico_ACME_Diciembre_","",Replacer.ReplaceText,{"Informe Económico_ACME_Diciembre_2016.xlsx"}),
    #"Replaced Value1" = Table.ReplaceValue(#"Replaced Value",".xlsx","",Replacer.ReplaceText,{"Informe Económico_ACME_Diciembre_2016.xlsx"}),
    #"Renamed Columns" = Table.RenameColumns(#"Replaced Value1",{{"No DE", "NroCuenta"}, {"DETALLE", "Cuenta"}, {"Attribute", "Mes"}, {"Value", "Valor"}}),
    #"Filtered Rows3" = Table.SelectRows(#"Renamed Columns", each ([Mes] <> "EST. DE RESULT.")),
    #"Renamed Columns1" = Table.RenameColumns(#"Filtered Rows3",{{"Informe Económico_ACME_Diciembre_2016.xlsx", "Anio"}}),
    #"Replaced Value2" = Table.ReplaceValue(#"Renamed Columns1","Informe Económico_ACME_Junio_","",Replacer.ReplaceText,{"Anio"}),
    #"Filtered Rows5" = Table.SelectRows(#"Replaced Value2", each true),
    #"Changed Type" = Table.TransformColumnTypes(#"Filtered Rows5",{{"Valor", type number}}),
    #"Added Custom2" = Table.AddColumn(#"Changed Type", "Mesnro", each if [Mes] = "ENERO" then "1" else if [Mes] = "FEBRERO" then "2" else if [Mes] = "MARZO" then "3" else if [Mes] = "ABRIL" then "4" else if [Mes] = "MAYO" then "5" else if [Mes] = "JUNIO" then "6" else if [Mes] = "JULIO" then "7" else if [Mes] = "AGOSTO" then "8" else if [Mes] = "SEPTIEMBRE" then "9" else if [Mes] = "OCTUBRE" then "10" else if [Mes] = "NOVIEMBRE" then "11" else if [Mes] = "DICIEMBRE" then "12" else null ),
    #"Changed Type1" = Table.TransformColumnTypes(#"Added Custom2",{{"Mesnro", type number}}),
    #"Sorted Rows" = Table.Sort(#"Changed Type1",{{"Mes", Order.Ascending}})
in
    #"Sorted Rows"
Here is the Power Query result:


Load
As a final step, Power Query allows you to load the transformed and integrated data (previous steps) and make it available for use.
We have two options:
- Table, which is the data loaded into Excel itself. From this data you can create pivot tables or other reports. The advantage of this option is that we have the restriction of number of records in Excel 1.4 million approximately.
- Only create connection, this option is the one that allows us to join the Power Pivot tool and Power Query, which allows us to add the information generated from Power Query and load it to Power Pivot, allowing us to handle billions of records.
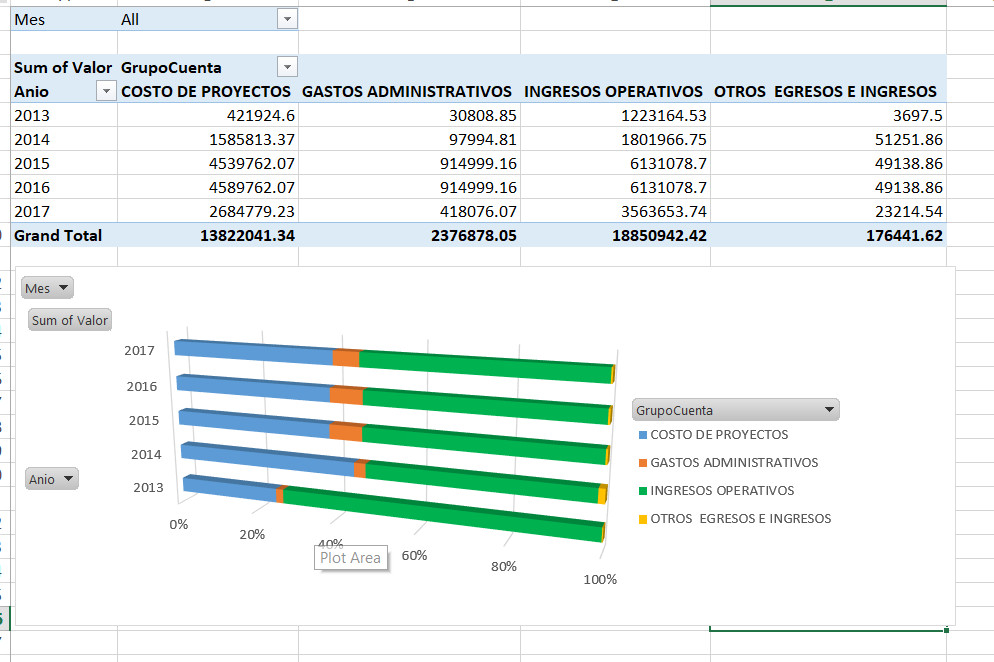
Example of Historical Financial Reports (Power Query + Power Pivot)

