
What is Business Intelligence?
July 18, 2017
Why is it important to know Power Query – Excel?
November 16, 2017
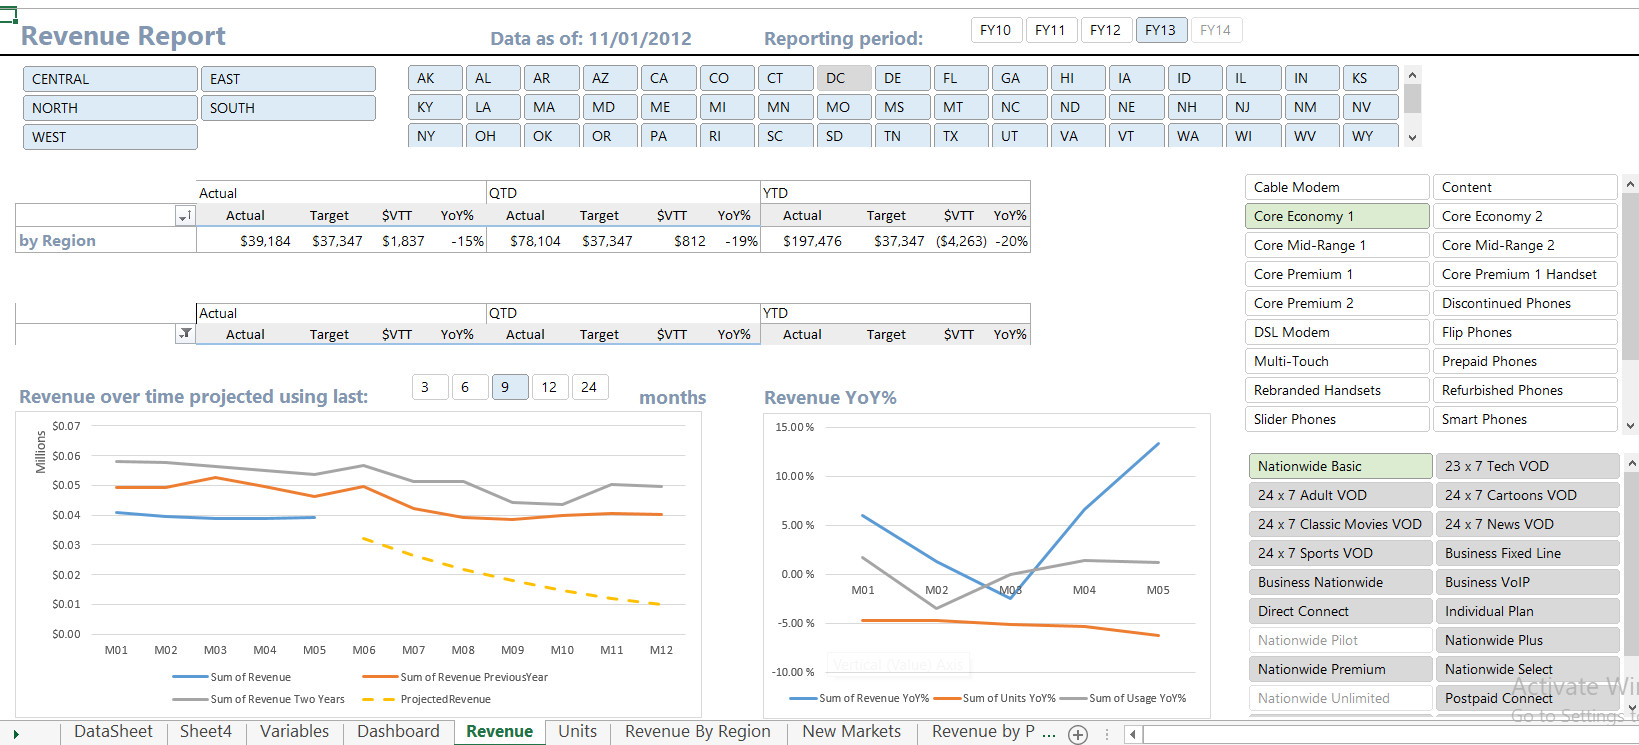
Power Pivot is an Excel analysis tool (available since version 2010) which allows us to create pivot tables (Power Pivot), but with much more potential making life easier. If you are one of those who like your reports to be automated and you had to use VBA for it, with Power Pivot you will achieve many of these purposes.
It is also known as a self-service business intelligence tool that allows end users of analysis to have options to make their reports, dashboard, without the need for systems personnel. This also has its disadvantages, if you do not know how to use it in your company, but that is for another article.
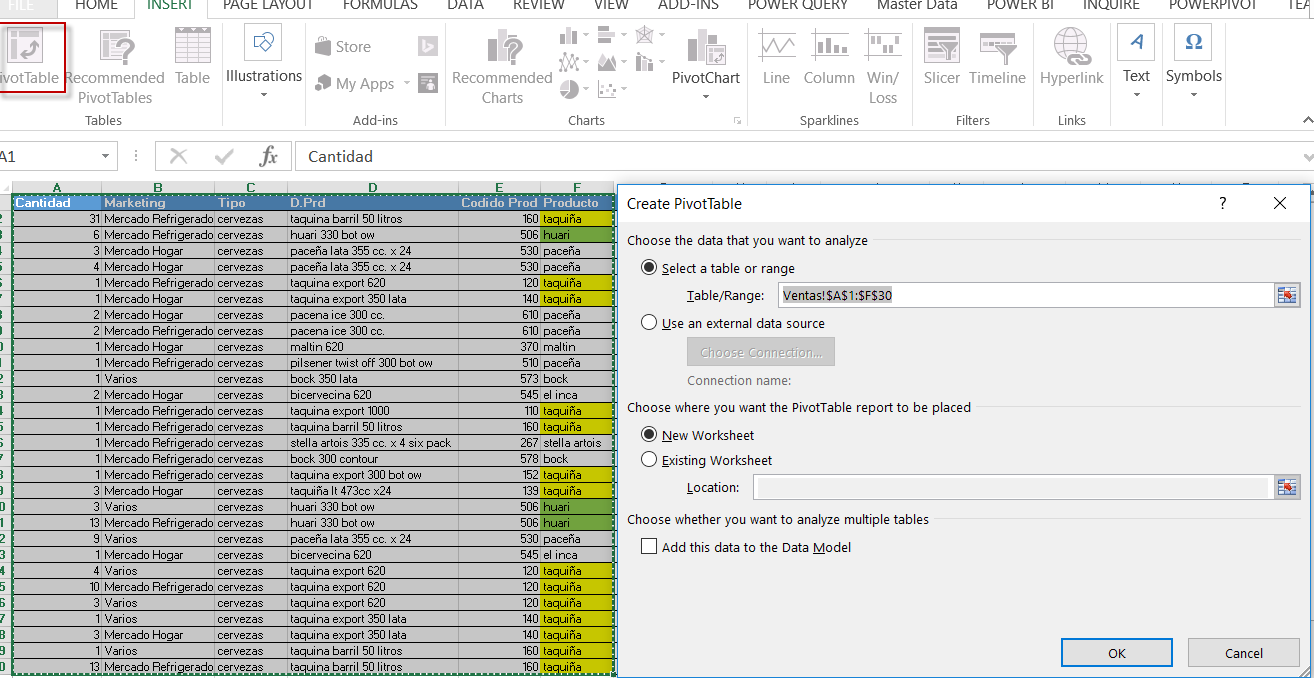
Pivot Table
Those who have experience using pivot tables know that we can generate reports, filter data, connect to database sources or excel itself, and create metrics such as sums, maximums, and averages. However, pivot tables have several limitations in comparison to Power Pivot, including:
- Pivot tables support approximately 1 million records, whereas Power Pivot can handle billions.
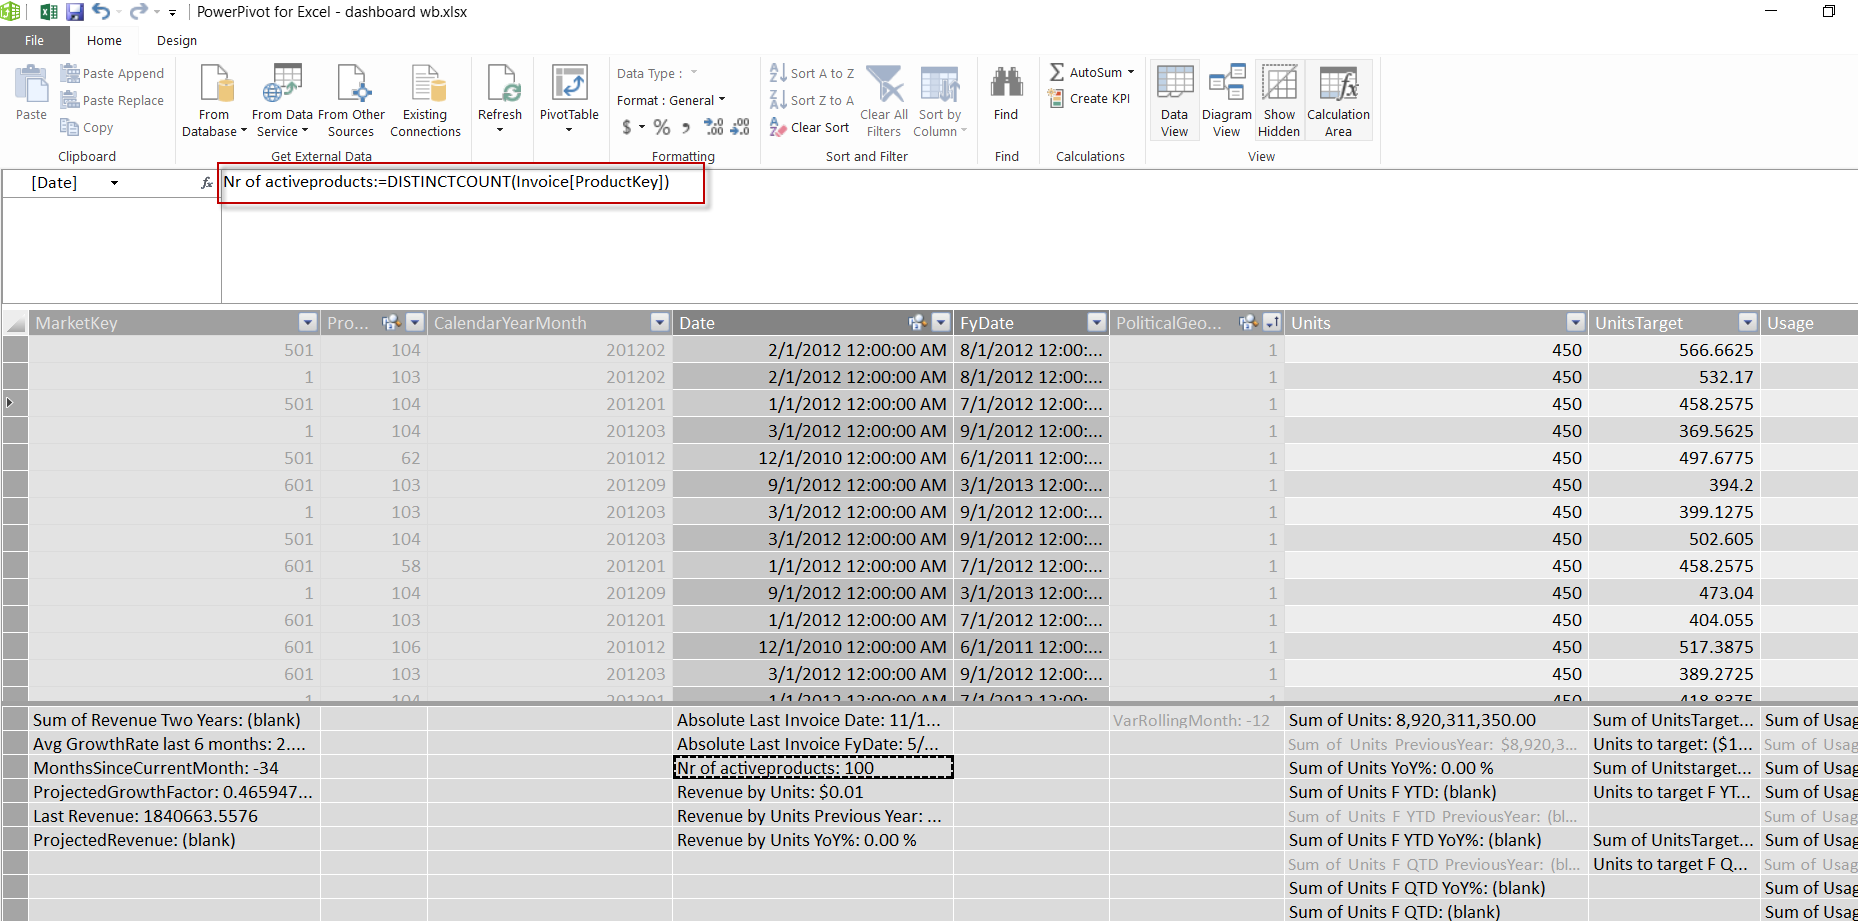
- With pivot tables, users can create only simple metrics like sums, maximums, and averages. In contrast, Power Pivot allows for the creation of more advanced metrics using a new language called DAX. It is often said that those who do not learn DAX will struggle to use Excel effectively in the future. For example, with DAX, users can create complex metrics such as:
Revenues for the last two years for comparison
Sum of Revenue Two Years:=if(HASONEVALUE(DateTable[FyYear]),CALCULATE([Sum of Revenue],DATEADD(DateTable[Date],-2,YEAR)))
Average of the last 6 months
Avg GrowthRate last 6 months:=CALCULATE(AVERAGEX(ALL(DateTable[YearMonth]), [Sum of Revenue YoY%]), ALL(datetable), DATESINPERIOD(DateTable[Date], CALCULATE(LASTNONBLANK(DateTable[Date], [Sum of Revenue]), ALL(DateTable)), [getTargetMonths]*-1, MONTH))
No. of active products (Products that were sold at least once)
Nr of activeproducts:=DISTINCTCOUNT(Invoice[ProductKey])

